Kernel and Boot Debug in Windows
A memo to debug the kernel of Windows with WinDbg
Open the Windows virtual machine cmd as admin. Open a COM port
bcdedit /dbgsettings serial debugport:1 baudrate:115200
To enable debug in kernel mode
bcdedit /debug on
To enable debug the boot manager and bootloader:
bcdedit /bootdebug {bootmgr} on # boot manager
bcdedit /bootdebug {current} on # bootloader
Shutdown the machine. Edit the setting in VirtualBox/VMWare:
- Open a serial port 1
- Set the mode to Pipe
- Set the path to
\\.\pipe\pipename
Open WinDbg or WinDbg Preview. Choose attach to kernel. Set the baudrate as specified and Port as \\.\pipe\pipename.
Turn on initial break to break automatically when a module is loaded in memory (bootmgr, winload.exe, winload.efi, ntoskrnl.exe).
Run the VM. Unless inital break is on, else press break to break.
Simple table to understand
| Command | Debug What | |
|---|---|---|
| bcdedit /debug on | ntoskrnl.exe | Windows Kernel |
| bcdedit /bootdebug {bootmgr} on | bootmgr.exe / bootmgr.efi | Windows Boot Manager |
| bcdedit /bootdebug {current} on | winload.exe / winload.efi | Windows Bootloader |
Sufffix .efi is used in UEFI boot mode.
Windows reference on boot process
If we want to set inital break on a profile without initial break, enter sxe ibp. If we want to break at a spcecific module sxe ld:module.
WinDbg also supports live kernel debug, livekd. Just attach to the local kernel as admin.
If using Windows 7 the debug symbols (pdb files) are not automatically downloaded. Must specify the path to the Microsoft symbol server:
.sympath srv*https://msdl.microsoft.com/download/symbols
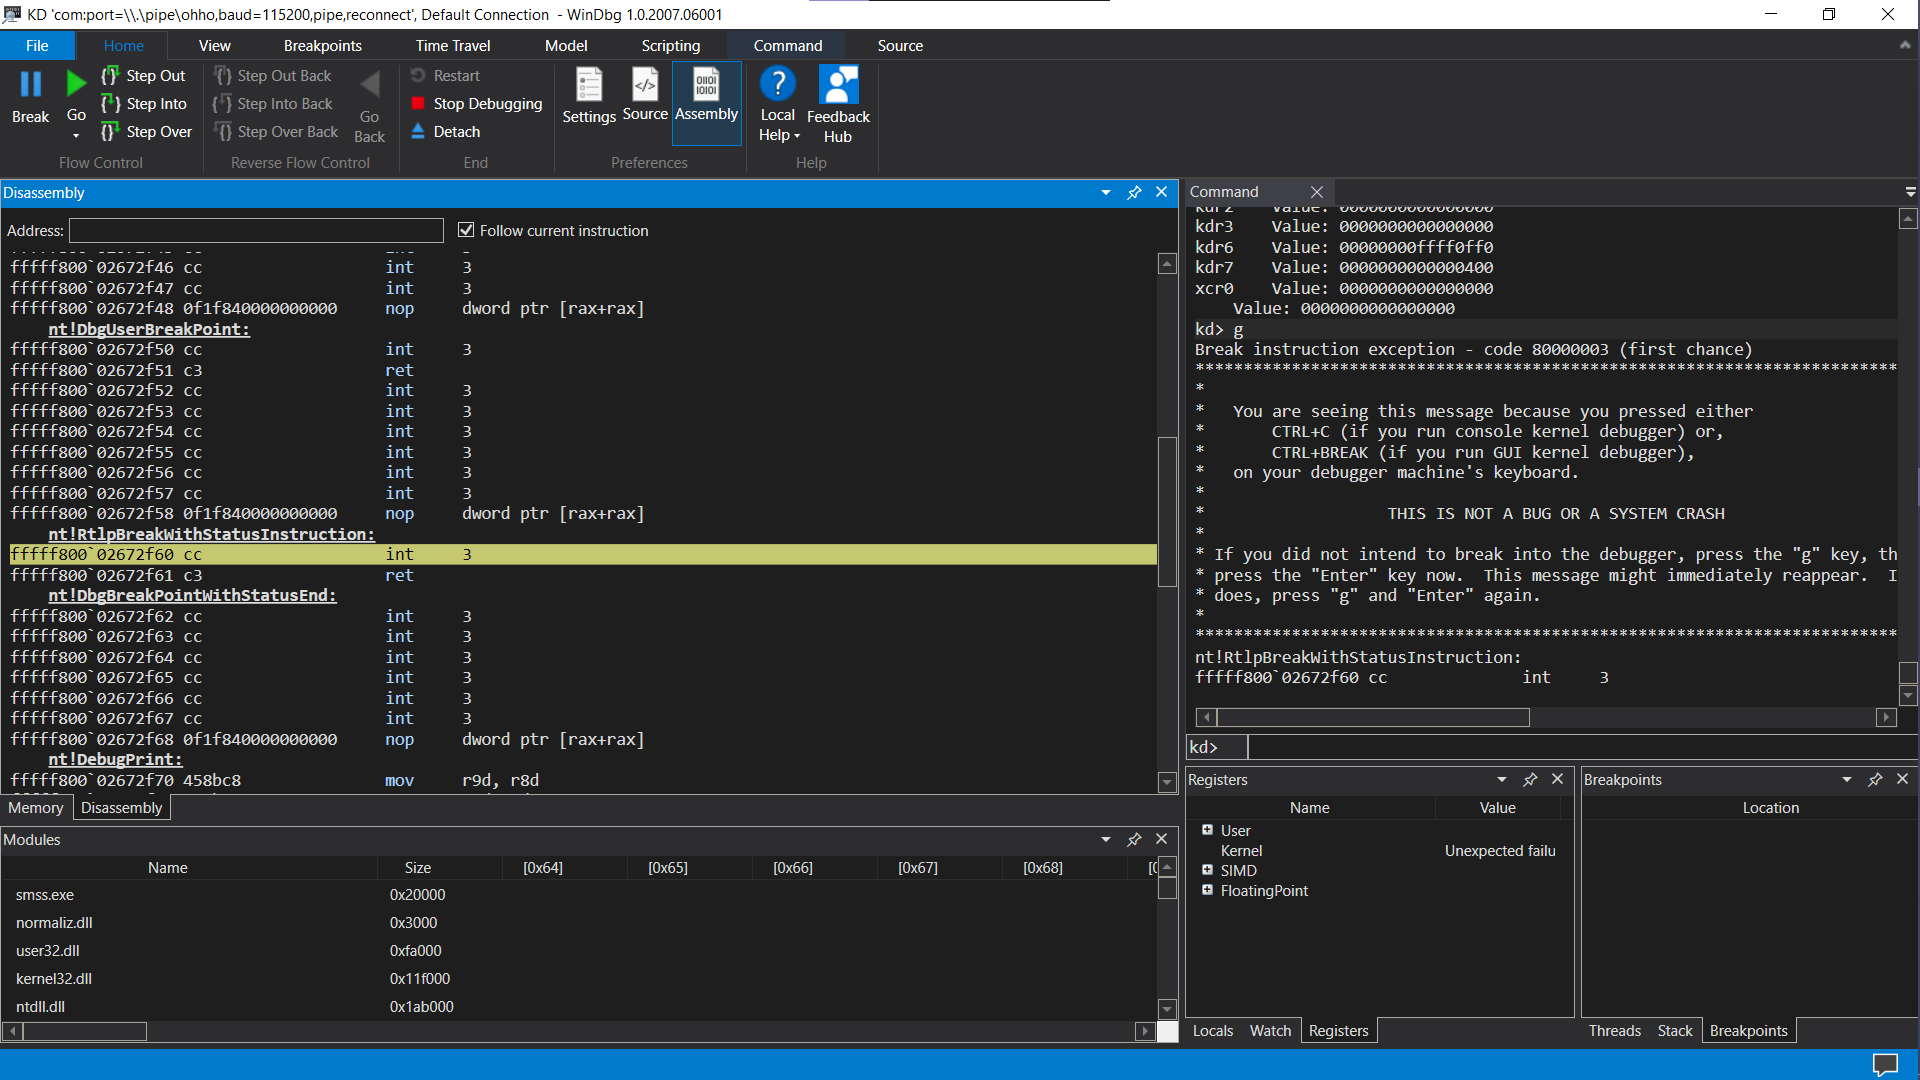
Set your WinDbg layout as you wish, I recommend this layout. Left is the disassembly, Right is the command, below left are modules, below right are breakpoints, threads, stack, watchpoint.
Some commands for process listing:
dx Debugger.Utility.Collections.FromListEntry( *(nt!_LIST_ENTRY*)&(nt!PsActiveProcessHead), "nt!_EPROCESS", "ActiveProcessLinks")

dx Debugger.Utility.Collections.FromListEntry( *(nt!_LIST_ENTRY*)&(afd!AfdEndpointListHead), "nt!_EPROCESS", "ActiveProcessLinks")

dx Debugger.Utility.Collections.FromListEntry( *(nt!_LIST_ENTRY*)&(nt!KiProcessListHead), "nt!_KPROCESS", "ProcessListEntry").Select( p => new {Process = (nt!_EPROCESS*)&p} )

dx Debugger.Utility.Collections.FromListEntry(*(nt!_LIST_ENTRY*)&nt!HandleTableListHead, "nt!_HANDLE_TABLE", "HandleTableList").Where(h => h.QuotaProcess != 0).Select( qp => new {Process= qp.QuotaProcess} )
Quick reference:
# print the system information
vertarget

# dump the address ast TYPE
dt TYPE ADDR [optional fields]

# print string
du

# print bytes at
db ADDR
dc ADDR # character

# print words at
dw ADDR

# print dwords at
dd ADDR

# print qword at
dq ADDR

# read physical address
!db
!dc
!dd
!dp
!du
!dw

# disassembly at
u ADDR
u FUNCTION

# break at
bp ADDR
bp FUNCTION

# next
p

# continue
g

# print stack trace
k

# list loaded modules
lm

# evaluate
? <expr>

# read register
r
r <reg>

# reference register
@rax
@rdx
>> dd @rax
>> dd @rax+0x10
>> dd @rax+10h
>> dd @rax+16

# list all process
!process 0 0
Update when I know more.
poi.process- Address Translation
- more?
Luibo
Just Chicken
I like programming languages. I want to read those compiler stuff, but I’m just a noob.